Moving Industry Financial Benchmarks & Analysis
Moving Industry Financial Benchmarks & Analysis
The Moving Industry’s Most Reliable Financial Benchmarking Tool
Stop guessing. Start knowing.
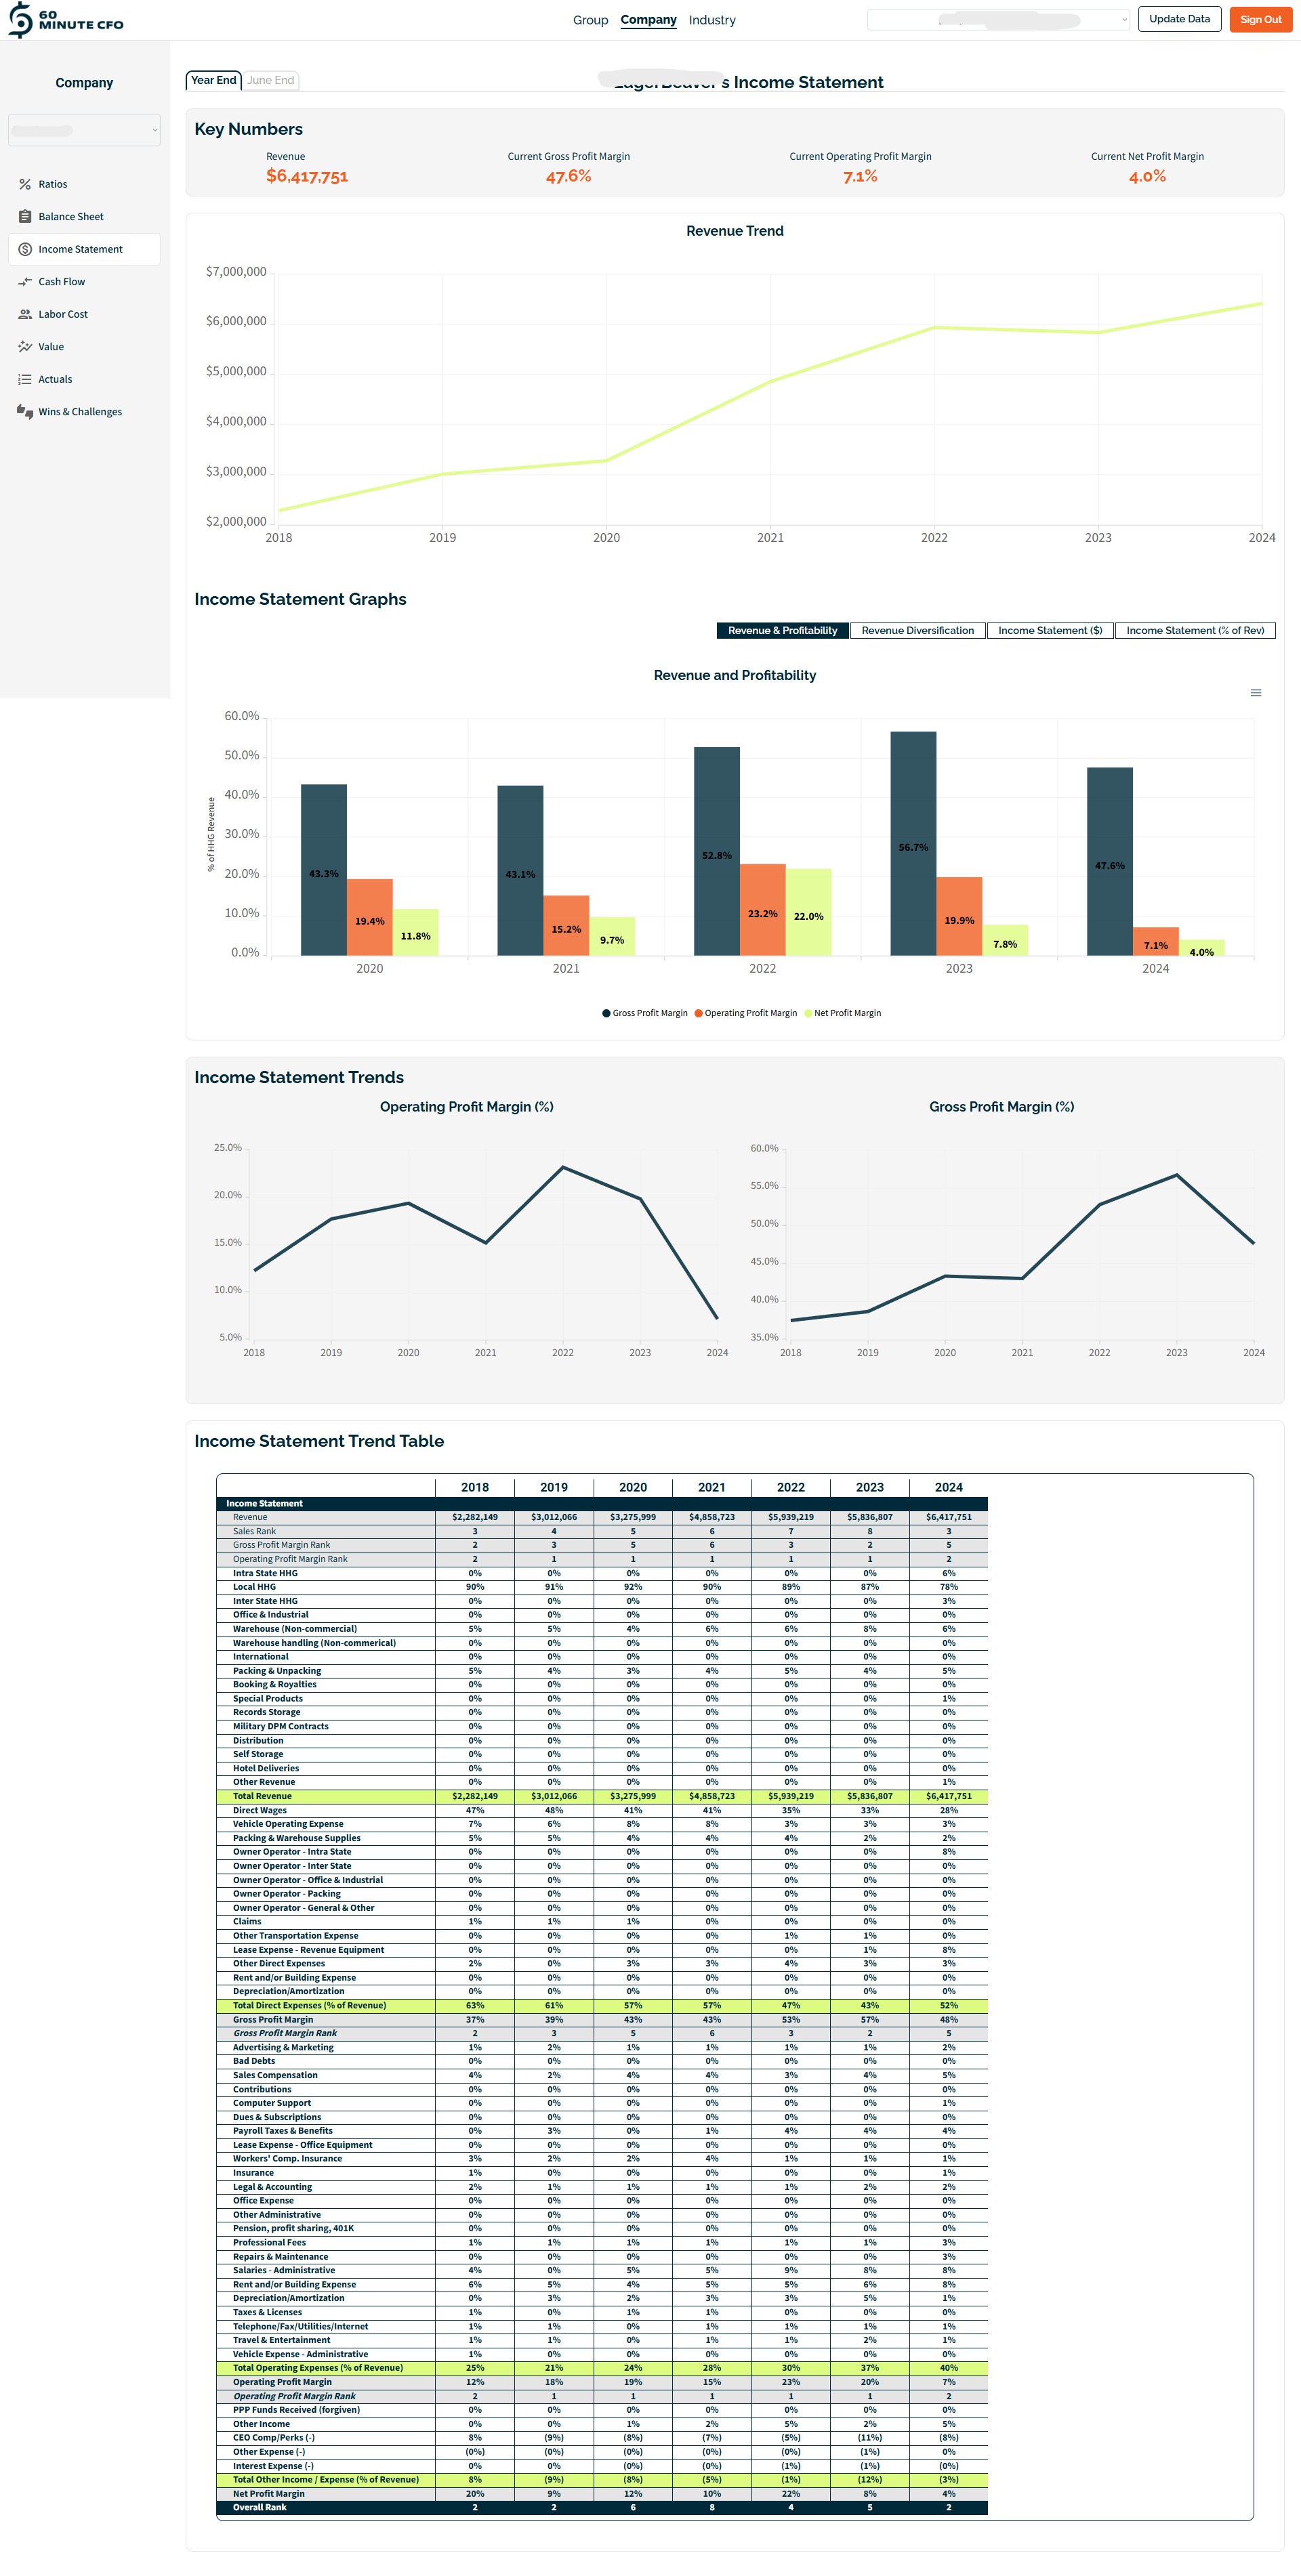
Get instant clarity on where your company stands—with the most accurate, standardized benchmark data in the industry. Built by financial pros who actually understand moving companies (because we work with them every day), this tool gives you both a custom analysis of your company and access to the most trusted industry benchmarks.
✅ What Makes This Benchmark Tool Different?
Standardized reporting – Every submission is mapped to our standardized chart of accounts, so you’re comparing apples to apples—finally.
Detailed chart of accounts - want to know how much someone spends on office supplies, marketing, or admin vehicles? We can tell you.
Built for movers, by financial educators who serve movers – This isn't some generic benchmarking tool. It’s built specifically for the moving industry, by the people behind 60 Minute CFO.
📊 How It Works:
Map your chart of accounts
You’ll align your Income Statement and Balance Sheet to our standard chart of accounts. Need help? We’ve got you.Upload your financials to the portal
Use our simple upload tool and submit your financials in the standard format.Get your custom company analysis
We’ll run your numbers through our proprietary system and deliver a clear, CFO-style report that tells you what’s working—and what’s not. Always in clear and simple English - not fancy finance speak.Access benchmark data
Compare your performance to other movers—filtered by independent vs. van line affiliated companies.
🧠 BONUS: Upload 2–5 years of historical data to unlock deep trend analysis and long-term insights.
🧭 Who This Is For:
Owners who want a clear roadmap to higher margins
Operators tired of guessing and ready to act on facts
Companies looking to build equity, not just revenue
CFOs, COOs, and Controllers who want clean, comparable data
Details:
We collect data every 6 months for year-end and June-end analyses.
If you submit between March 15 and October 15, you will get year-end numbers (full-year analysis). If you submit between October 15 and March 16 you will get June end numbers (1/2 year analysis).
Your access will last for 6 months

